Case study — Cross-engine AI citation research, January to June 2026
The study this is about: Cross-engine AI citation overlap study, published on the Wellows blog.
The study went live on 29 July 2026. By 3 August I had rewritten it twelve times, retracted two of its headline findings, corrected a false claim about where the data came from, and published all of it on the same page as the original numbers.
This is the record of how that happened and what the process was.
The starting point
The study measured how often five AI engines cite the same source when answering the same question. ChatGPT, Gemini, Perplexity, Google AI Overviews and Google AI Mode, six months of data, drawn from Wellows' internal citation dataset.
The raw pool was 22,749,707 citations across 1,146,483 questions and 441,946 websites. After dropping blank-domain rows and keeping only questions all five engines answered, the analysis base came to 531,889 questions, 13,037,251 citations, 280,245 websites and 8,729,964 engine-pair comparisons.
The headline: 79.61% of cited websites appeared on one engine only. The full distribution ran 79.61 / 14.47 / 4.36 / 1.25 / 0.31 across one to five engines.
Two other findings sat underneath it. Brands co-occurred across engines 4.5 times more often than pages did, so brand looked like the durable layer. And the two Google surfaces agreed 3.4 times more than cross-company pairs, so shared infrastructure looked like the driver.
Both of those are now retracted. The 79.6% still stands.
Why verification became the project
Kevin Indig published a similar analysis in his Growth Memo on 18 May 2026 and landed at 91% single-engine across three engines. Ahrefs put AI Overviews and AI Mode URL overlap at 13.7%. SE Ranking put it at 10.7%. My equivalent figure was 24.5%, roughly double both of them.
That gap is what started the verification work. If my number is the outlier, either everyone else is measuring something narrower or I am measuring something wrong, and I could not tell which without rebuilding the method from scratch.
The rebuild took three weeks. It found problems I was not looking for.
The framework: six passes, in order
Each pass asks a different question. None of them substitutes for another, which is the part I got wrong for the first two weeks.
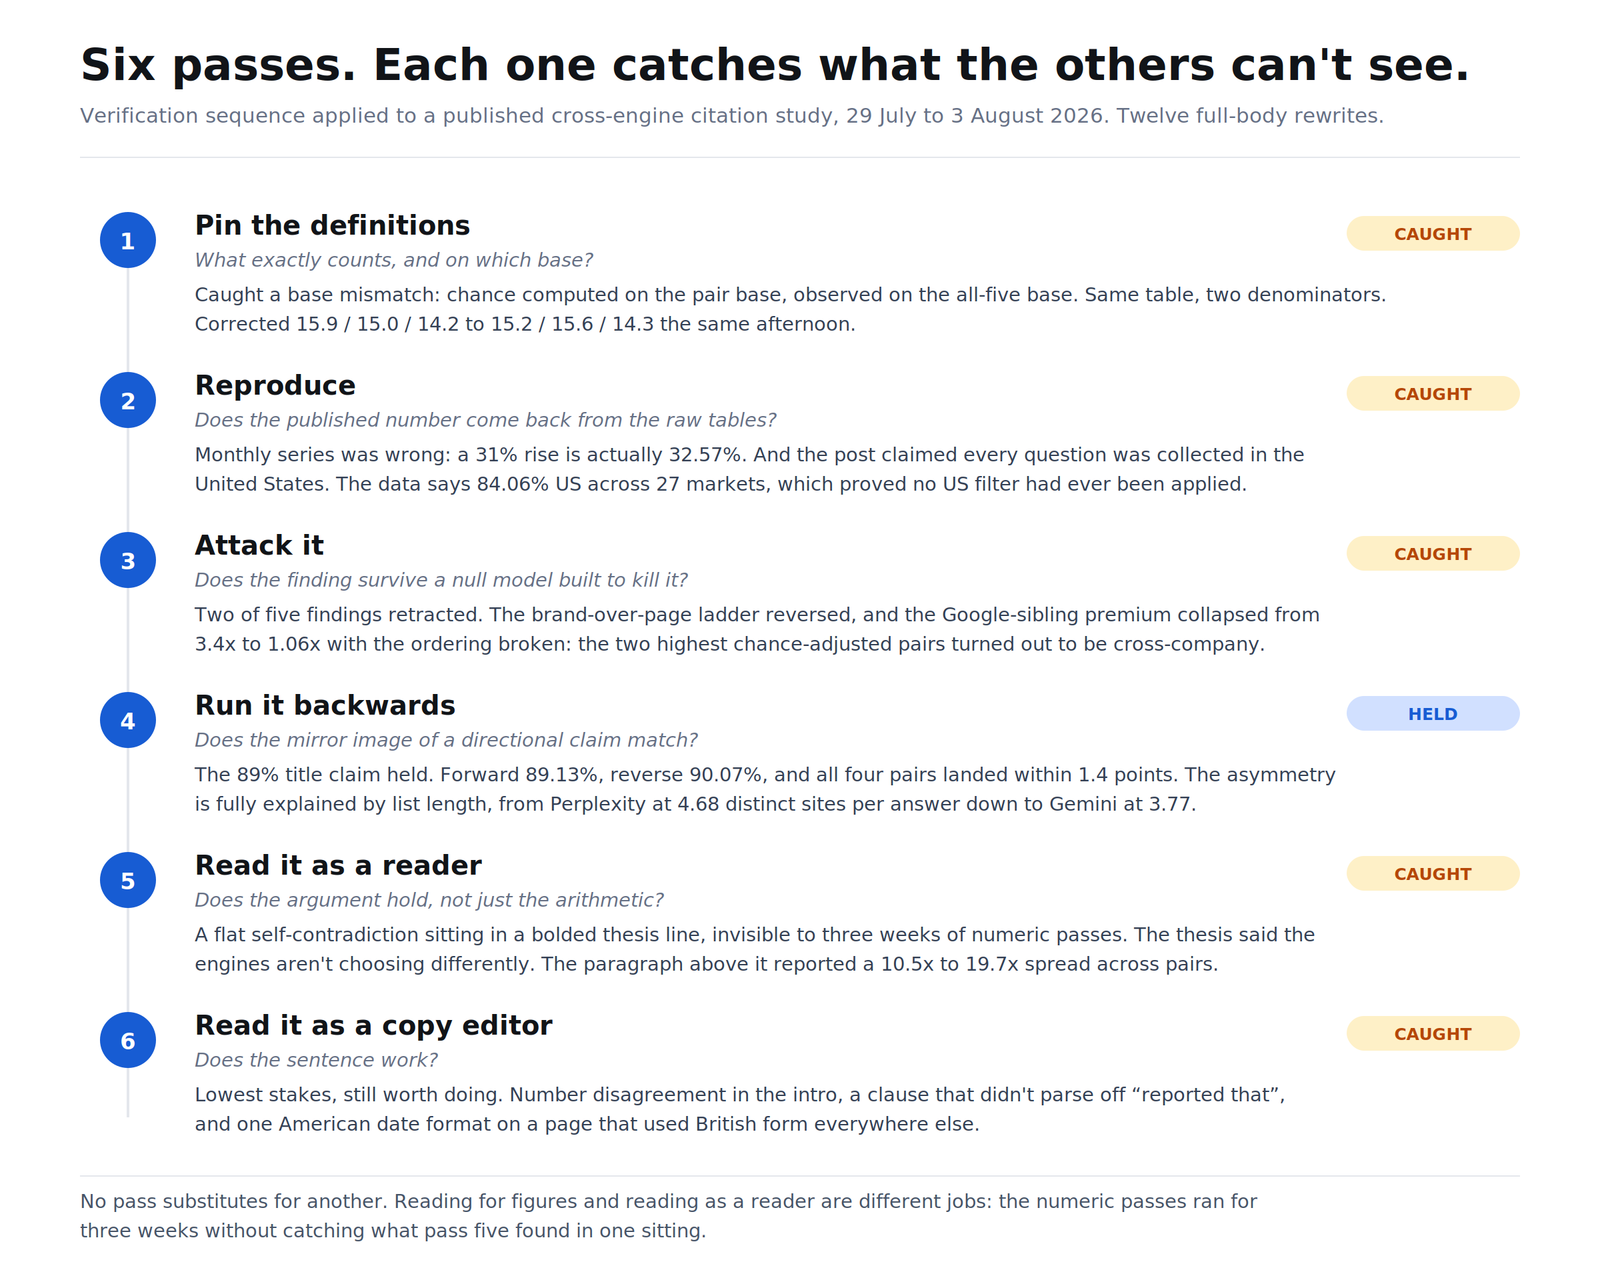
Pass 1. Pin the definitions. Before running anything, write down every filter, every normalisation, every base. What counts as a website. Which rows get dropped and in what order. Whether a figure sits on the all-five base or the pair-specific base.
I skipped this initially and paid for it. Weeks of back-and-forth came from verifying numbers against guessed definitions. The fix, which is now a standing rule: when a number will not reproduce, enumerate every candidate definition in one query rather than testing one per round.
Pass 2. Reproduce. Rebuild every published figure from the raw tables and check it comes back.
The base chain reproduced exactly. So did all ten engine-pair figures, the per-engine uniqueness shares, the four directional figures and the robustness ladder. The monthly series did not. Published was 8.58 / 8.35 / 8.74 / 10.14 / 11.13 / 11.25, a 31% rise. The correct series is 8.487 / 8.344 / 9.034 / 10.382 / 11.015 / 11.251, a 32.57% rise at 0.553 percentage points per month.
The same pass found something worse. The post said every question was collected in the United States. The data says 84.06% United States across 27 markets, led by Australia, the UK and the Philippines. Adding a US filter reproduced no published figure, which proved the original analysis had never applied one.
Pass 3. Attack it. Build a null model and see whether the finding survives contact with it.
This is the pass most research in my field skips, and it is where both retractions came from. Detail below.
Pass 4. Run it backwards. The title claim was that 89% of what ChatGPT cites, Perplexity never touches. Directional claims have a mirror image, and if the mirror looks very different, the claim is an artefact of which engine you put first.
Forward, Perplexity 89.13%. Reverse, 90.07%. Every one of the four pairs came in within 1.4 points, and three of four reverses came out higher than their forward. The asymmetry is fully explained by list length: mean distinct websites per answer runs Perplexity 4.68, AI Overviews 4.47, ChatGPT 4.15, AI Mode 3.97, Gemini 3.77. The shared numerator is identical in both directions, so the engine with the longer list always shows the higher missed-by figure.
The title held. I only know that because I ran it.
Pass 5. Read it as a reader. Not as a checker. Straight through, start to finish, asking whether the argument holds rather than whether the arithmetic does.
Three weeks of numeric passes had missed a flat self-contradiction sitting in a bolded sentence. The thesis line said the engines are not choosing differently, they are choosing from different slices of the web. The paragraph directly above it reported a chance-adjusted spread of 10.5x to 19.7x across pairs, which means they demonstrably do choose differently. Both were mine. Neither pass could see the other's problem.
Pass 6. Read it as a copy editor. Grammar, tense, spelling, date format, serial commas.
Lowest stakes, and still worth doing. It caught a sentence with number disagreement in the intro, a clause that did not parse off "reported that", and one American date format on a page that used British form everywhere else.
The permutation test, in detail
The method: pair engine A's source list for a question with engine B's list for a different, randomly chosen question. Hold list lengths and item popularity fixed. Whatever agreement survives that is the agreement you would get from two engines drawing independently from the same pool of plausible sources. Real agreement minus chance agreement is what the finding is actually worth.
One implementation trap cost me a full cycle. Shuffling with FARM_FINGERPRINT(query_id) is deterministic across providers, so the permutation join silently reproduces the observed join and chance comes out equal to observed. The key has to be FARM_FINGERPRINT(CONCAT(query_id,'|',seed)), partitioned by pair.
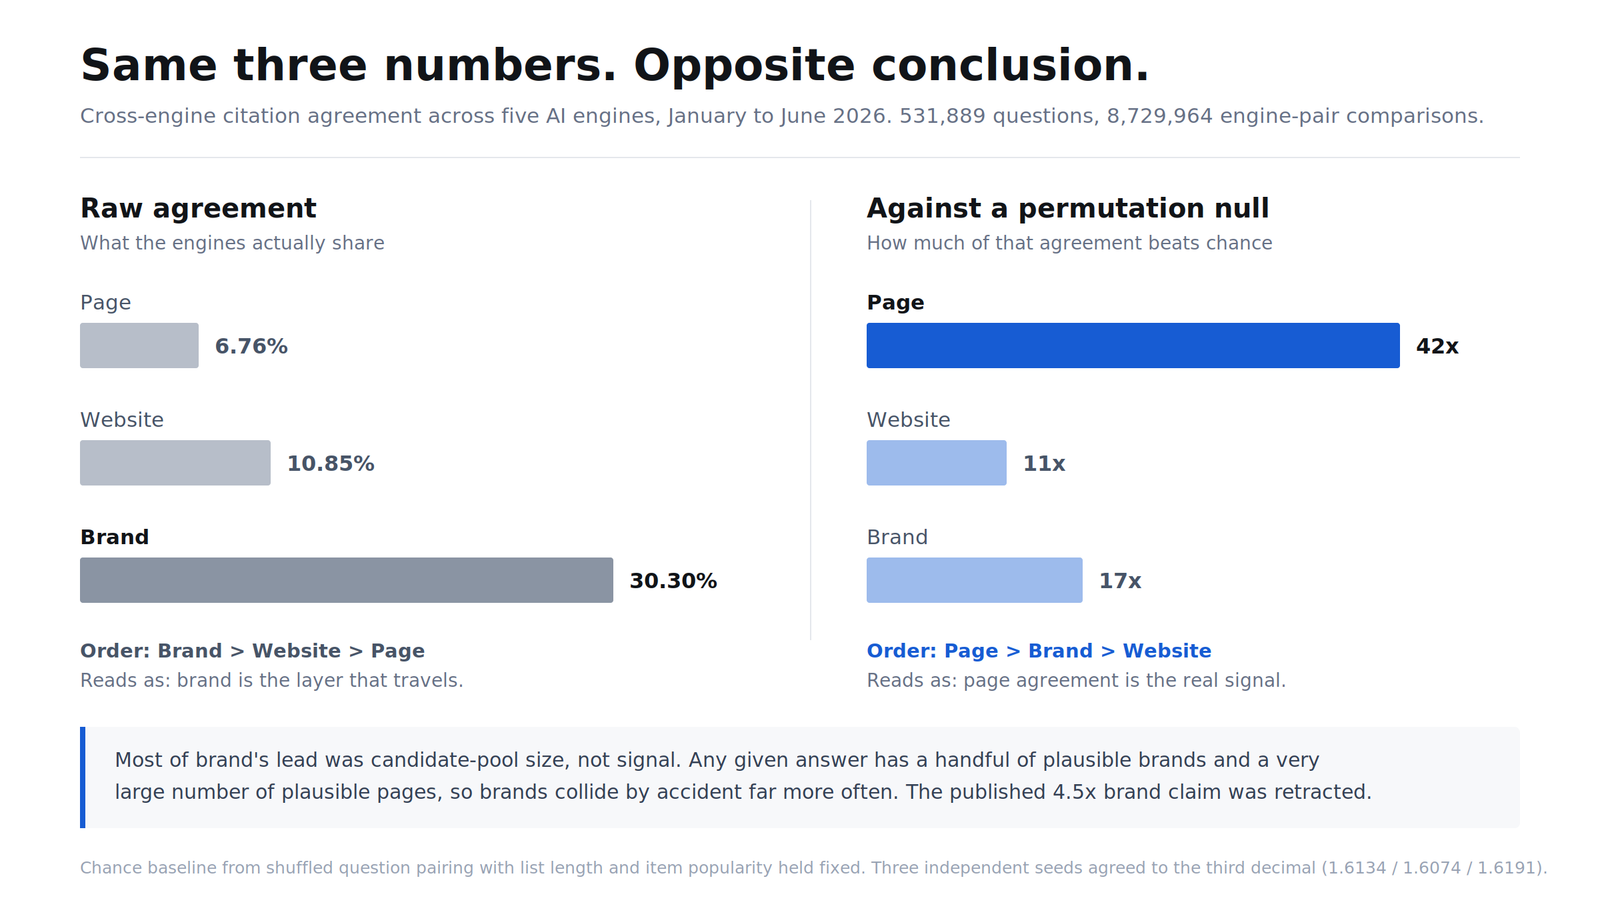
Three independent seeds agreed to the third or fourth decimal (1.6134, 1.6074, 1.6191). At this sample size permutation variance is negligible.
What it did to finding one. Raw agreement ran page 6.76%, website 10.85%, brand 30.3%, so brand looked 4.5x better than page. Against chance the same three run 0.16%, 1.00% and 1.79%. That makes page agreement 42x chance, brand 17x and website 11x.
The ladder reverses. Most of the brand advantage was a candidate-pool artefact, because an answer has a handful of plausible brands and a very large number of plausible pages. Brand is still the easier layer to hold across engines in absolute terms. It is not the stronger signal.
What it did to finding two. The two Google Search surfaces agreed 24.5% against 7.3% for cross-company pairs, a 3.4x premium that looked like clean evidence for shared infrastructure. Chance-adjusted, the tiers land at 15.2x, 15.6x and 14.3x. The premium collapses to 1.06x, and the ordering breaks entirely: Gemini paired with either Search surface (15.6x) outscores the two Search surfaces paired with each other (15.2x). The two highest chance-adjusted pairs in the whole set are both cross-company, Gemini and Perplexity at 19.7x and ChatGPT and Perplexity at 19.1x.
I got the first version of this wrong too. The figures I published at 11:46 on 30 July (15.9 / 15.0 / 14.2) divided observed values computed on the all-five base by chance values computed on the pair base. Same table, two different denominators. Corrected to 15.2 / 15.6 / 14.3 the same afternoon, and the method section now states that chance baselines are computed on the same base as the figure sitting beside them.
What died, what survived
| Finding | Raw | Against chance | Status |
|---|---|---|---|
| 79.6% single-engine | 79.61% | not baselined | Held. Survived stricter matching (85.1% and 93.2% under looser tidying) and a 3.3-point monthly band |
| 89% ChatGPT gap | 89.13% | not baselined | Held. Reverse direction 90.07%, within 1.4 points on all four pairs |
| Brand travels 4.5x better than pages | 30.3% vs 6.8% | 17x vs 42x | Did not survive. Ladder reverses |
| Google surfaces agree 3.4x more | 24.5% vs 7.3% | 1.06x, ordering breaks | Did not survive |
| Convergence, 33% in six months | 8.49% to 11.25% | never run | Untested. Now flagged in-post as the least-tested finding |
Three ways a number fails to reproduce
I started out reporting every non-reproducing figure as "could not confirm". That is imprecise enough to be useless, because the three causes need different responses.
Unfinished work. I stopped looking too early. The published top-of-range category figure of 15.5% looked unconfirmable until I noticed I had been reading 50 rows sorted ascending and had never looked at the top of the distribution. Backup and recovery runs 15.66%. That was never a tooling limit. It was me.
Underdetermined definition. Several defensible conventions give genuinely different answers and nothing in the data adjudicates between them. Brand-level agreement comes out 54.96%, 30.57% or 25.11% depending only on which pairs you keep. The 54.96% turned out to be almost exactly the 54.6% figure in an earlier draft that had been retracted as an error. It was not an error. It was a different convention nobody had written down.
Tooling limit. The query will not complete. Unnesting brand mentions across five providers on a 37 GB table times out through the connector, so settling 30.30 against 30.57 needs a materialised intermediate table rather than another attempt at the same query.
There is a fourth thing that looks like a failure and isn't: a unit mismatch. I raised one topic running at 27.19% as contradicting a published category range that tops out at 15.5%. Topics pool into categories. A narrow topic averages down. The post's own method paragraph already covered it, and I burned a cycle on an alarm that was never real.
What it cost, and what is still open
Twelve full-body rewrites over five days. An internal review rubric scored the piece before the second pass at 82 factual, 68 research, 62 logic, 70 conceptual, 88 content, 66 SEO, 64 CRO. After: 93, 79, 84, 86, 90, 70, 74. Research quality stayed capped near 79 until the chance baseline existed, which is the honest reading of what a study is worth before anyone attacks it.
Still open, and stated as open on the published page rather than papered over: the permutation draws its comparison question from anywhere in the set, so a same-category null would put every multiple lower. The convergence finding has never been baselined at all. No overlap coefficient has been run alongside Jaccard. And a 0.27-point gap between my brand figure and the original pipeline's is diagnosed but not resolved.
The rule I took from it
A finding is worth what it is worth against a null model, and you do not know that number until you build the null model and run it against your own work.
Two of mine did not survive. The page stayed up, the retractions went on it, and the study is more defensible now than when every number in it was still standing.
The full study, including the corrections described here, is published at wellows.com/blog/ai-citation-overlap-study.

Read next
SEO vs AEO vs GEO: What Each One Actually Means, and How to Sequence Them
SEO, AEO, and GEO are layers, not rivals. A working definition of each, where they genuinely diverge, and the order to build them so the work compounds.
Read the post →Topic Cluster Architecture That Actually Scales Organic Traffic
Publishing more rarely fixes a plateau — fragmented architecture does. How to structure pillars, clusters, and internal links so authority concentrates.
Read the post →